NLDS Game 1 · Padres at Brewers · October 3, 2026
In the ninth inning in Milwaukee, Ty France launched a fly ball toward the left-field corner. About 180 feet in the air it clipped a cable hanging from the closed roof, was knocked into a steep dive, and was caught on the warning track. Would it have been a home run without the roof? We rebuilt the ballpark in 3D, pulled a stopwatch out of the slow-motion replays, and ran thousands of simulated flights to find out.
I don’t care about the math, show me the answer ↓
A ball with nowhere to go
Top of the ninth, one out, Padres down 3–2. Brewers closer Trevor Megill throws a 98.9 mph fastball, and France sends it high toward the left-field line. American Family Field’s retractable roof is closed, as it often is in October.
The replays tell the real story.
The ball climbs into the roof structure, clips one of the cables hanging beneath it, and is knocked sharply downward, though it keeps carrying toward the corner. Brewers left fielder Jackson Chourio, already camped on the warning track, catches it. Under the park’s ground rules that’s a live ball, so the catch is an out.1 The Padres challenged whether it hit over fair territory, and the call was upheld.
The ruling was right. But everyone in the building still had the same question: was that gone?
Why the stat sheet says “no”
MLB’s Statcast system tracks every batted ball. For this one it reports 105.3 mph off the bat at a 49° launch angle, a 323–325 ft distance, and a note that it would have been a home run in only 1 of 30 ballparks.
That looks like a closed case, but look at what the distance is measuring. Statcast’s 323–325 ft can only describe the ball after it hit the cable, because that’s the only flight there was. The “1 of 30 parks” is computed from that number. It answers “where did this ball go?”, not “where would it have gone?”
Rebuild the flight from the footage
Nobody can replay the at-bat without a roof. But we can do the next best thing: reconstruct exactly how the ball was flying from the video that exists, then use a physics simulation to finish its flight as if the cable had never been there.
The physics is the easy bit. A batted ball is about as predictable as anything in sports: gravity pulls it down, air drag slows it, and backspin gives it lift. The hard part is the reconstruction. Statcast tells us how the ball left the bat, but not how well it was carrying, so we had to piece that together from the broadcast footage. That meant solving four problems:
Problem 1: How long was the ball in the air?
To simulate the flight we need its timeline: how long after bat contact the ball hit the cable, and how long until it landed in Chourio’s glove. The live broadcast can’t tell us. It cuts between three cameras, none of which shows the roof. The replays show everything, but in slow motion of unknown speed.
Except that the speed isn’t really unknown. Broadcast slow motion here doesn’t invent new images: it shows each real camera frame several times in a row. A real frame is captured every 1/60 of a second, so if you count only the new frames, you’re counting real time.
That’s a strong claim, so we checked it two independent ways.
Check 1: the same footage, played twice
FS1 showed the view from the right-field corner twice, at two different slow-motion speeds (Replays 2 and 3). If slow motion only repeats real frames, both replays must contain exactly the same new frames, just held on screen for different lengths of time.
Check 2: a moment we can see in real time
Right after the catch, Chourio fires the ball back to the infield. The live broadcast shows that moment in real time, and Replay 2 shows it too. Counting frames, the live broadcast gives about 65 and the replay’s new frames about 68, both just over a second. That isn’t precise enough to settle a difference of a few percent, but it rules out the replay running at the wrong speed altogether (2× or 3× slow motion mistaken for real time): the replay’s “new frames” tick at roughly real-life speed.
The result
Two different replay cameras agree on about 6.4 seconds from bat to glove. We use Replay 2’s 6.35–6.55 seconds, with the cable strike at 2.92–3.16 seconds.
Wait, the live TV broadcast is shorter. Why trust the replays?
On the live broadcast, bat to glove takes only 5.94 seconds (356 frames), about 0.4 s less than the replays. We can’t explain the gap. The clip itself is clean: a steady 59.94 frames per second with no dropped or repeated frames, and the camera cut about a second before the catch doesn’t skip time, because Chourio’s run carries straight across it. If the broadcast lost time, it wasn’t there.
We trust the replays anyway, for three reasons. The live footage runs at real time within each shot: the pitch takes 0.36 s to reach the plate, just as Statcast’s pitch data says it should. The two replay cameras agree with each other. And taking the live timing at face value would mean this ball carried about 50 feet farther than any comparable hit in the last three seasons.
And the live number doesn’t help the “no” side anyway. A shorter flight means the ball covered the same ground faster, which makes it a stronger carrier. Re-running everything with 5.94 s makes a home run more likely. A longer flight is the direction that would hurt, so we tested that too (see the stress tests at the end).
Problem 2: Where are the cameras?
A replay tells you where the ball was in the picture. To turn that into where it was in the stadium, you need to know exactly where the camera was and which way it was pointing.
Broadcasters don’t publish that, so we solved for it, the way a surveyor would. First we built the field in 3D from official measurements: the foul lines, the bases 90 feet apart, the pitcher’s mound, the curve of the infield dirt, and the outfield wall. Then, for the opening frame of each replay, we found the one camera position, aim, and zoom that makes the 3D model line up with the picture.
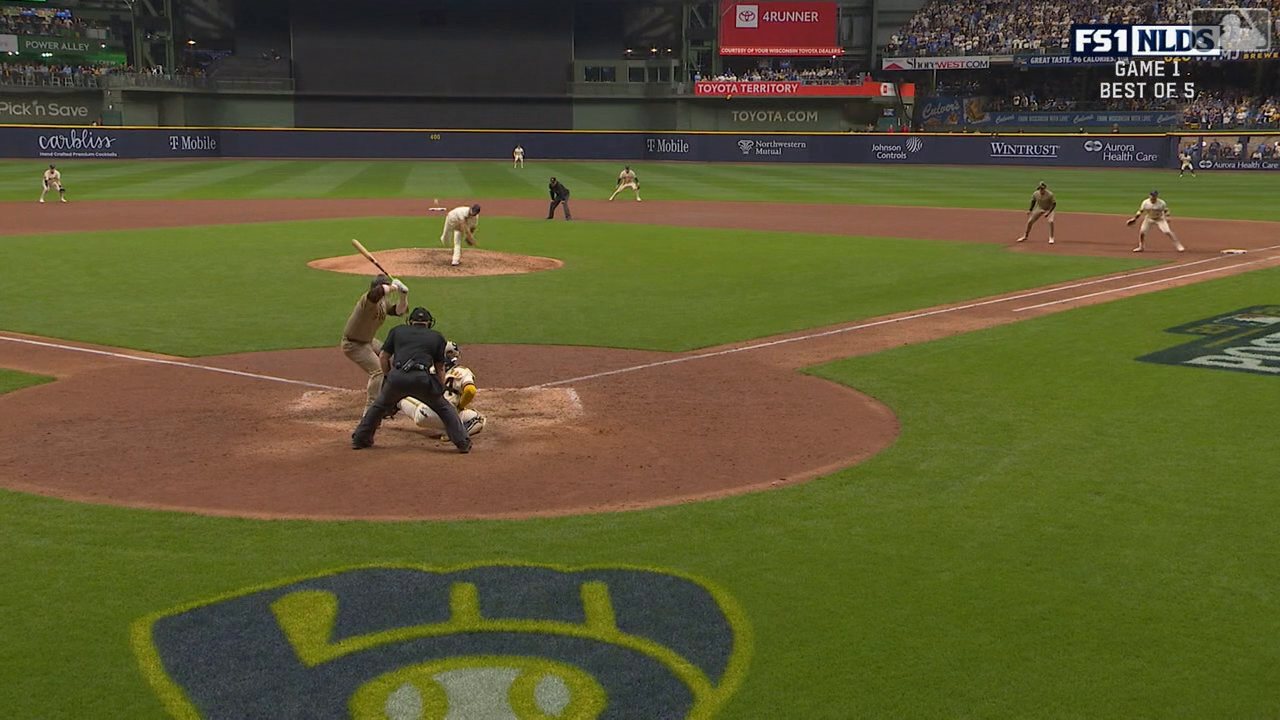
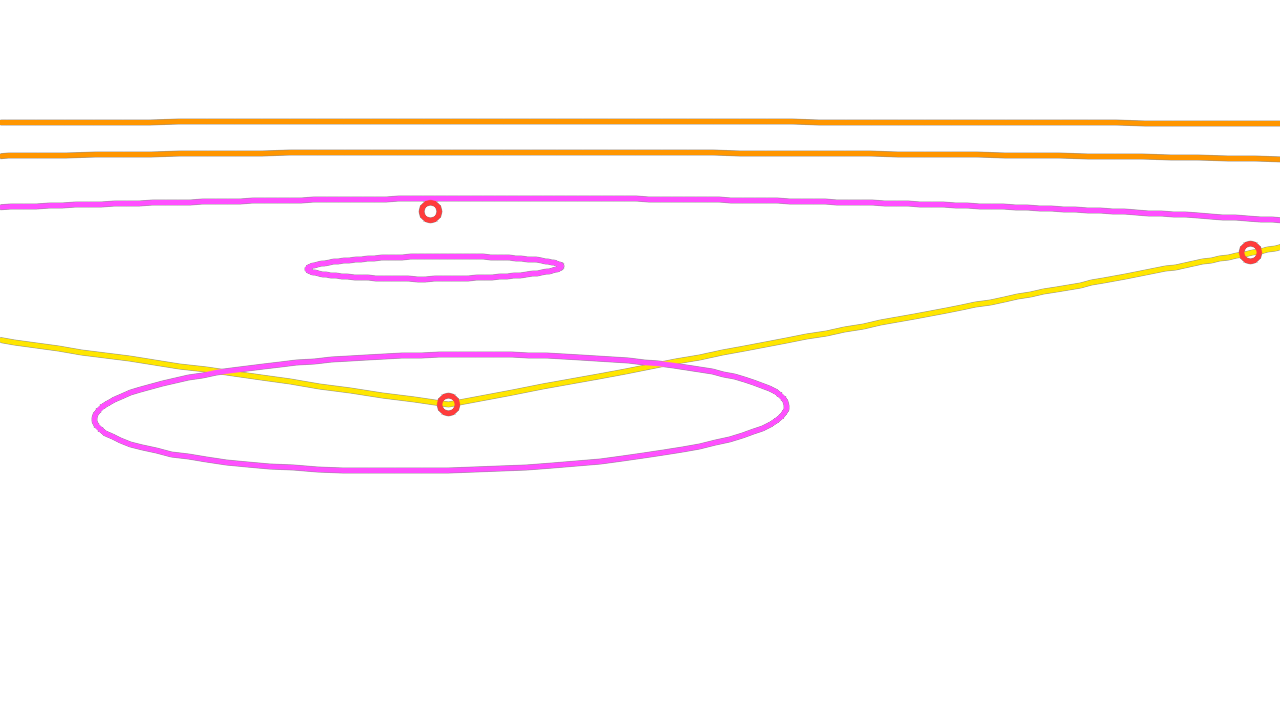
Replay 1 turns out to come from a low camera about 56 feet behind home plate and 10 feet up. Replay 2, the one that shows the impact best, comes from the right-field corner, looking back across the field toward left.
How exact are the camera positions?
The solved cameras line up with the field markings to within about 6 pixels on a 1280-pixel-wide frame (5.6 px for Replay 1, 6.1 px for Replay 2).
The right-field camera uses a long telephoto lens. That makes its direction very precise but its distance fuzzy: anywhere from about 345 to 420 ft down the line fits the picture equally well. We don’t pick one; every later step is run across that whole range.
Problem 3: Was the ball still rising?
The timing already tells us what to expect. A ball hit like this one peaks around 3.2–3.5 seconds after contact, and the cable strike came at about 3.1, so it should still be on its way up. The video lets us check that directly, and it shows something the timing can’t: how hard the cable knocked the ball down. The best view comes from the camera in the right-field corner, but that camera pans and zooms to follow the ball, so the ball’s motion in the picture is misleading.
The fix is simple: we locked every frame to the roof girders behind the ball. The camera moves; the roof doesn’t. Stitched together, the frames become one fixed view of the roof, and the ball’s path across it is its true direction of travel as seen from that corner.
Follow the red line and two things jump out. First, the ball is still climbing right up to the cable. This camera is watching the ball move away from it, and a ball moving away at a constant height would drift downward in the picture. Holding level means it was still gaining height. Second, the cable doesn’t just nick it: the path bends sharply down, about 20 degrees in the picture within two frames.
Problem 4: Where exactly was the catch?
The last thing we need is where the ball ended up. Statcast puts it at 323–325 ft. That’s the distance of the knocked-down ball, which is exactly what we need here, but it’s a surprising number. With the wall about 349 ft out in that direction, it puts Chourio roughly 25 feet in front of the wall. A standard warning track is about 15 feet wide, so on a normal track that’s a catch on the grass. The video plainly shows him on the dirt.
Of everything in this analysis, the catch spot moves the answer the most, so we didn’t take Statcast’s number on faith. We checked it two ways.
Check 1: the shape of the corner
Chourio makes the catch in the left-field corner, a few panels into fair territory from the “342” sign at the foul pole. From the ground it looks like an ordinary warning track. From above, it isn’t: the wall cuts across the corner at an angle, the grass edge follows it, and the dirt between them is wider than a standard track. In the direction France’s ball was headed, the wall is about 349 ft from home plate.3
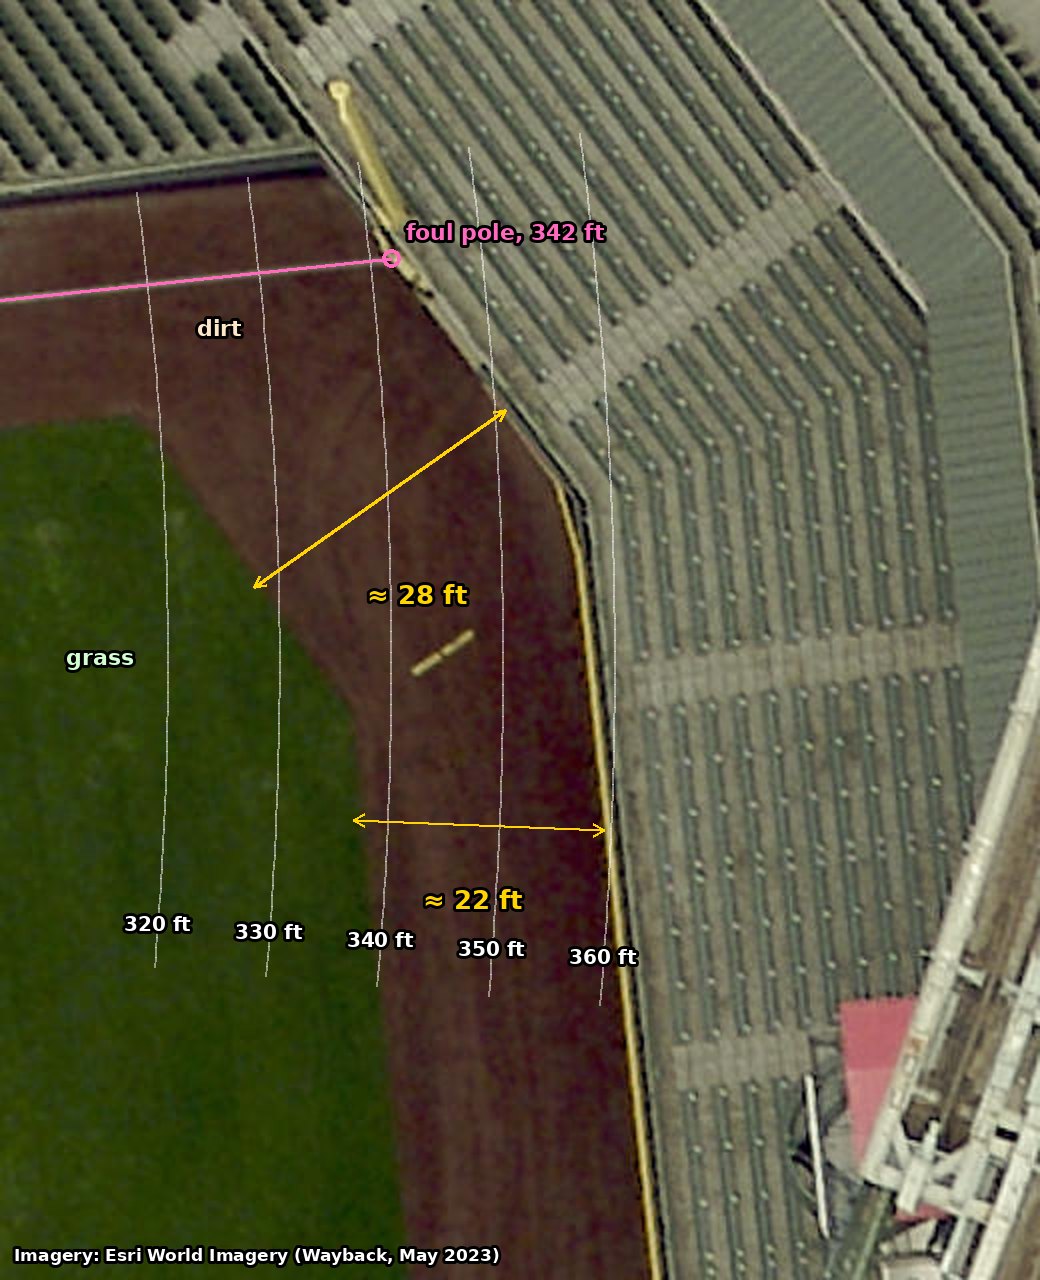
That answers the puzzle. Looking out from home plate along his line, which crosses the angled corner on a slant, the dirt runs more than 30 feet in front of the wall, so a catch at Statcast’s distance is still on the warning track.
Check 2: two cameras, two sightlines
The shape of the corner shows Statcast’s distance is possible, but it doesn’t measure it. One camera can show which direction a player is in, but not how far away he is. Two cameras in different places can: he’s standing where their sightlines cross.
The live camera behind home plate gives the direction. Using the 8-foot wall as a ruler, Chourio’s feet are about 11 feet to the fair side of the foul line, about 2° into fair territory. Statcast’s direction for the ball agrees.
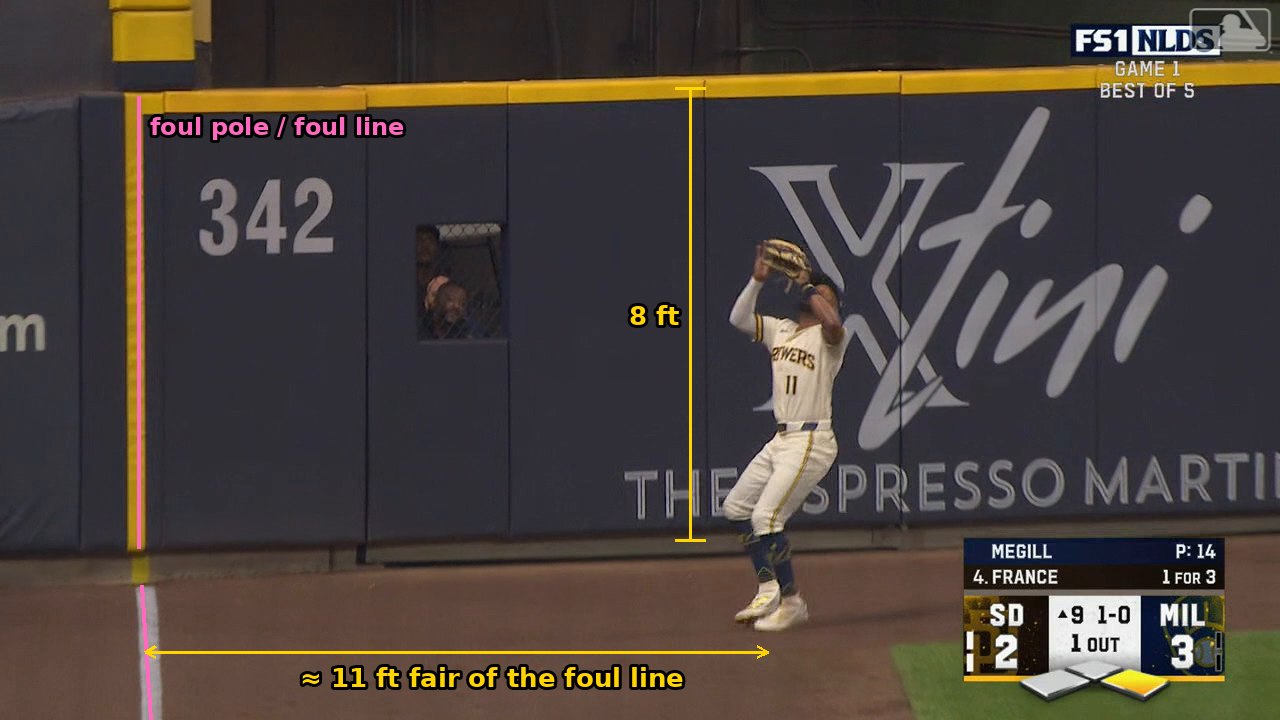
Replay 2’s camera, out in the right-field corner, sees him from the side. From there, how far he is from home plate shows up as how far he is from the foul line in the picture.
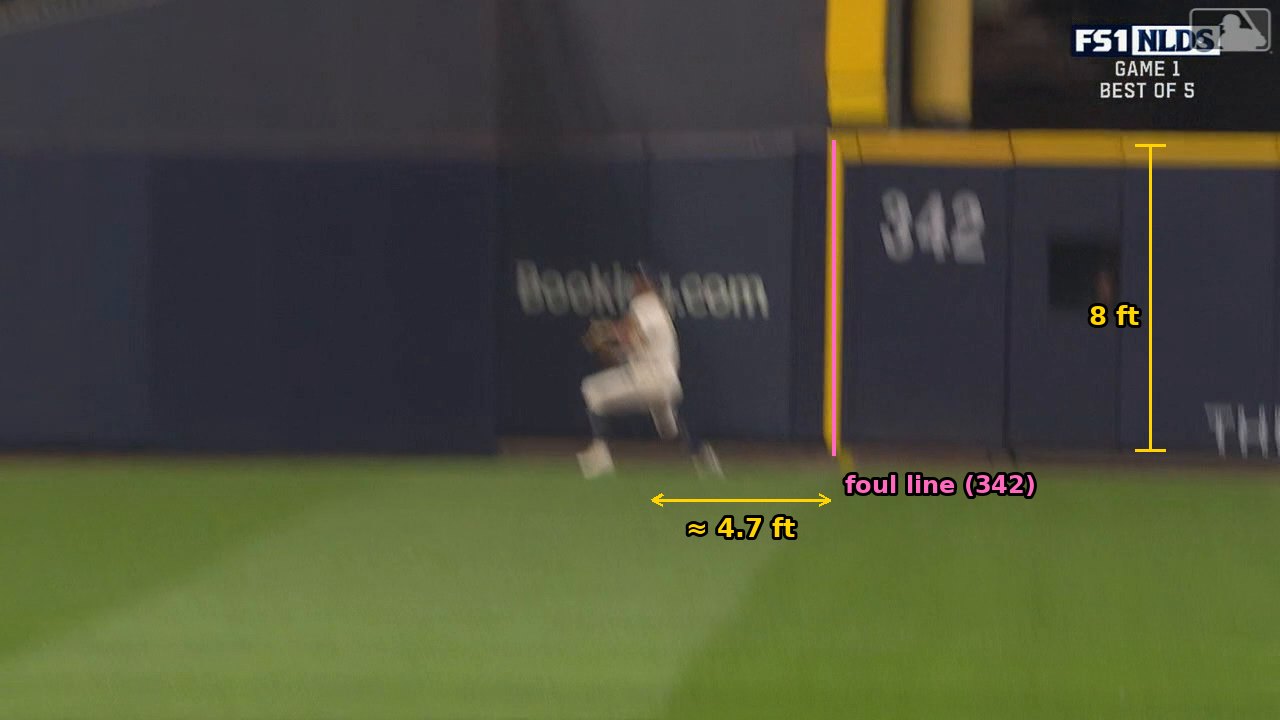
Drawn on the aerial photo, the two sightlines cross about 326 ft from home plate:
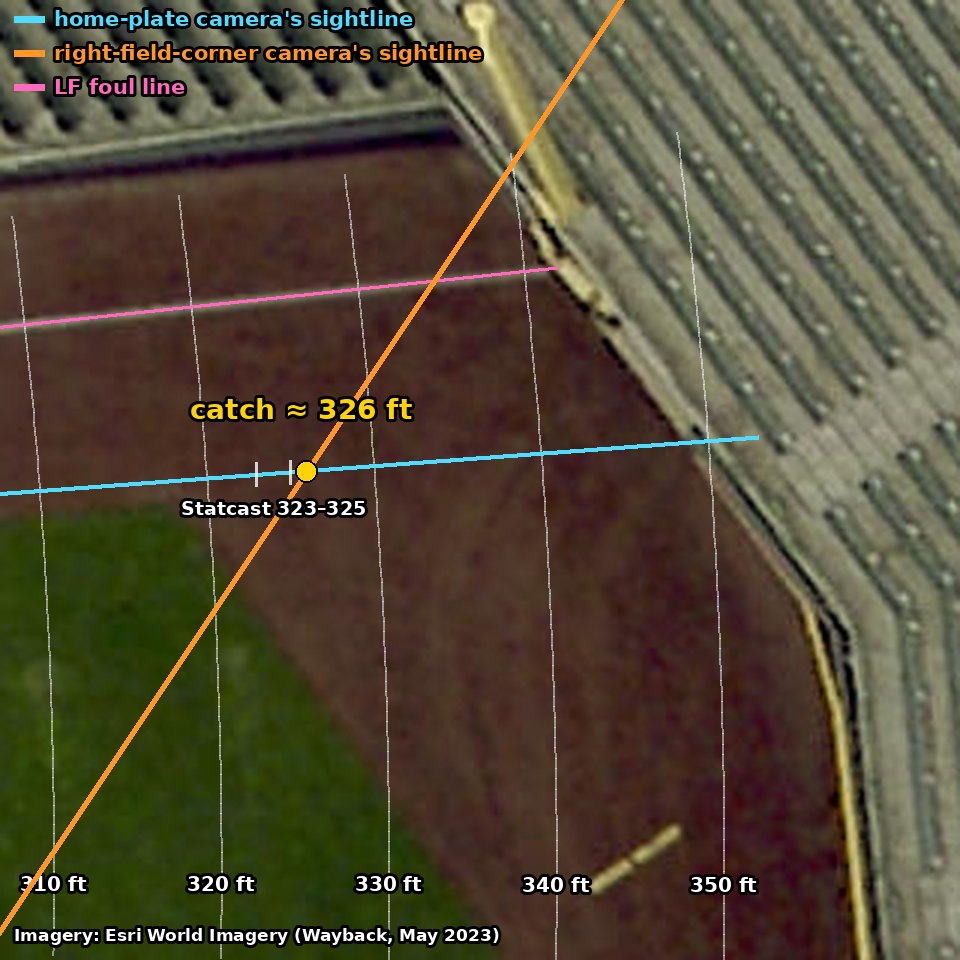
So Statcast’s number holds up: the sightlines put the catch where Statcast does, and the shape of the corner explains why that spot is on the dirt. We use a catch 323–330 ft from home plate, with the ball at glove height, about 7 feet up.
How precise is that?
The live camera pins down his direction to within about a quarter of a degree. The right-field camera’s position is the bigger unknown: its telephoto lens fixes its direction precisely but not its distance (Problem 2), and anywhere from 345 to 420 ft down the line moves the crossing point by about 3 ft. Add the uncertainty in reading his feet against the wall, and the crossing lands anywhere from about 323 to 330 ft.
To check the aerial photo’s scale, we located home plate from the cover over it. The center of the pitcher’s mound cover sits 59.0 ft away (the rulebook distance is 59 ft), and the foul line meets the wall within about a foot of the posted 342.
A few feet matter here: each foot of catch distance moves the final probability by about 4 percentage points. The stress tests at the end re-run the analysis at 322 ft, just below the range, and at 330 ft, its upper end.
Thousands of flights, three tests
Now we can run the experiment. We know exactly how the ball left the bat. What we don’t know is how well it carried, which depends on two things Statcast doesn’t publish: how much backspin it had (more spin, more lift, but also more drag), and how much the air dragged on it (ball-to-ball variation, seams, the indoor air).
So we tried them all: thousands of simulated flights, each with a different mix of spin and drag. Every one had to pass three tests to stay in the running:
- Reach the cable at the right moment, at the right height, still on the way up.
- Make the catch: after a realistic knock from the cable, still land in Chourio’s glove at the right time.
- Match the camera: trace the same path the right-field camera saw.
The exact pass/fail rules
Flights tried: drag coefficient 0.22–0.44, backspin 1,000–4,000 rpm, launch angle 48.5–49.5°, and direction within 1.5° either side of Statcast’s, all at 105.3 mph. Still air, as it was inside the closed stadium, at 600 ft elevation.
Reach the cable: at least 172 ft up and still rising at some moment between 2.92 and 3.16 s after contact. The stadium district has said its lowest roof cable is 175 ft above the field.4
Make the catch: there must be a post-impact velocity that brings the ball to the catch point (323–330 ft out, 7 ft up) at 6.35–6.55 s, and the cable has to push the ball down, never adding speed. After the cable, the ball keeps half its backspin; the stress tests also try keeping all of it.
Match the camera: the flight, projected into Replay 2, must reproduce how the ball’s climb flattens (its slope in each of the last 16 frames before impact) and its steep drop afterward.
For the flights that survive, we can finally do the thing nobody could do on October 3: take the roof away and let them fly. Try it yourself below.
Play with the sliders and a pattern emerges. A typical ball hit like this (average drag, around 3,000 rpm of backspin) does get up to the cable. But it can’t reach Chourio’s glove in time, even with a perfectly gentle deflection: it simply hasn’t traveled far enough by the 6.4-second mark. That’s the stat-sheet intuition (“balls like this are outs”) colliding with the evidence. The catch is the evidence that this particular ball was carrying better than average. Every flight that passes all three tests is a better-than-average carrier. The “Most likely” flight here only just clears the wall, but it’s one flight in one launch direction; across all the flights that fit, weighted, the median clears it more comfortably.
Does the simulation actually match the video?
Before we take the roof away, here is what the third test looks like. This is a representative flight that passes all three, laid over the real ball and zoomed in on the moments around the impact:
This is the check that ties the reconstruction to what actually happened. A simulation can be tuned to match anything you show it, so it matters what this one was shown. The flight up to the cable comes from the physics and the timing; the flight after the cable is solved from where and when Chourio caught the ball. Neither half is drawn by copying the ball’s path in this video. The camera test then asks whether a flight built from those facts moves the way the real ball did, frame by frame, and flights that don’t are thrown out or count for less.
Exactly what was fitted, and what wasn't
We projected the simulated flight into the right-field camera’s view and let the computer adjust only that camera’s zoom and aim, using only the 20 tracked positions before the impact. Because that alignment is fitted, a close match before the impact is expected; what it confirms is the shape of the climb as it flattens into the cable.
The flight after the impact was solved separately, from just two facts: where Chourio caught the ball, and when. The camera test scores it on one number after the impact, how steeply the ball drops right after the hit, and the flight shown is one of the best-scoring. Its frame-by-frame path over the 10 frames after the impact comes from the catch alone, and it follows the real ball.
Before the impact, the match is within about 1.3 inches. After it, the simulated ball stays with the real one, typically within about 4 inches, as seen from a camera roughly 440 feet away.
The simulation reproduces what the camera saw. So now, finally: what happens to these flights without a roof?
So, without the roof?
The replay timing, the cable strike and the catch spot all point the same way, but not by much, and most balls hit like this stay in the park. Our best estimate is a ~68% chance it would have been a home run: about two in three. It would have landed about 358 feet from home plate, crossing the left-field wall about 16 feet up, over its 8-foot top but not by much. The biggest uncertainty is exactly where Chourio caught it: a few feet either way moves the chance anywhere from 54% to 85%.
That probability comes from weighing every surviving flight by how ordinary its spin and drag are, and by how closely it matches the camera.5
The median no-roof flight lands about 358 feet from home (90% range: 344–380 ft), crossing the 8-foot wall about 16 feet up: over it, but not by much. About a third of the flights that fit the evidence come down short of the top.
Explore it in 3D
Drag to rotate, pinch or scroll to zoom, and drag with two fingers to pan. Everything here is the same reconstruction: the field, the walls, the roof’s track beam, both replay cameras, and the flight. The dotted line drops from the cable strike straight down to the ground, so you can see exactly where it was over the field.
One last thing
There’s a catch hiding in the question itself. “Without the roof” doesn’t just mean without the cable. It means without the walls and glass that were keeping October out.
Everything so far was flown in the air the ball actually flew through: inside a closed ballpark, still, at 69°F. But the roof was closed for a reason. Outside, it was about 58°F at 11 p.m., with light rain starting.6 Colder air is denser, and denser air drags harder on a baseball: for a ball like this one, every 10 degrees costs roughly 4 to 5 feet of carry.
So we took every flight that fit the evidence and flew it one more time, in the air outside:
In 58°F air, the chance of a home run drops from about 68% to about 50% (27% with heavier spin and drag). The median flight lands about 353 feet out and reaches the wall about 8 feet up, right at the top of the 8-foot wall.
The roof cut both ways. It’s what stopped the ball, but it’s also what kept the cold out. Open it and the cable is gone, but so is the warm air that was helping the ball carry. With the roof out of the way, France’s fly ball was probably gone, but only if you keep the indoor weather. Under the October sky, it was anyone’s guess.
Update: Actually, one more thing
Added October 6, 2026
After this post went up, a reader, @joelrondeau_ on Threads, asked something we hadn’t: even if the ball went far enough, might it have landed foul?
We never checked. Everything above asks whether the ball went far enough, not whether it stayed fair. We borrowed its left-right direction from Statcast, which reflects where it was caught, after the cable. And our simulated flights had no sidespin, so they all flew dead straight. Real fly balls pulled toward a foul line often curve.
The view from behind home plate
Replay 1 looks straight out from behind home plate, so any left-right drift shows up directly in the picture. First we had to sharpen its aim. Our original calibration put the foul pole a couple of degrees off, enough to matter here, so we re-aimed the camera on the pole itself.
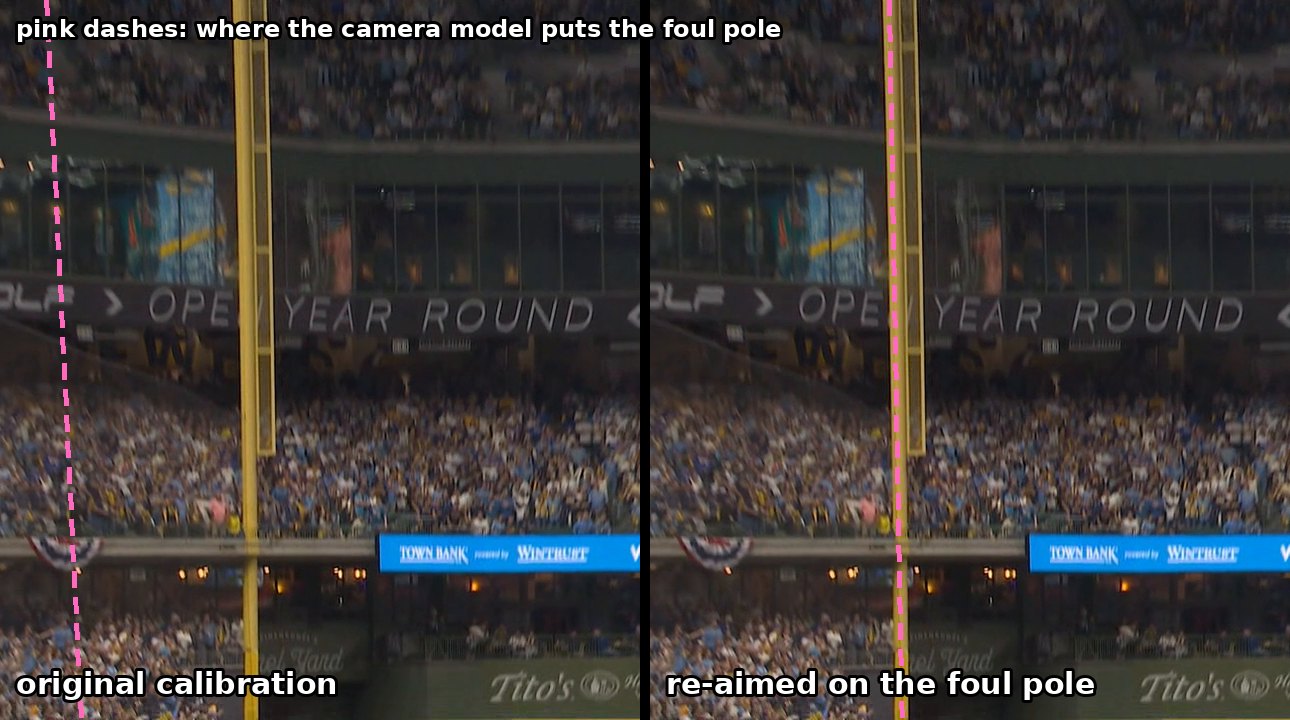
Then, as in Problem 3, we locked the frames to the roof and followed the ball:
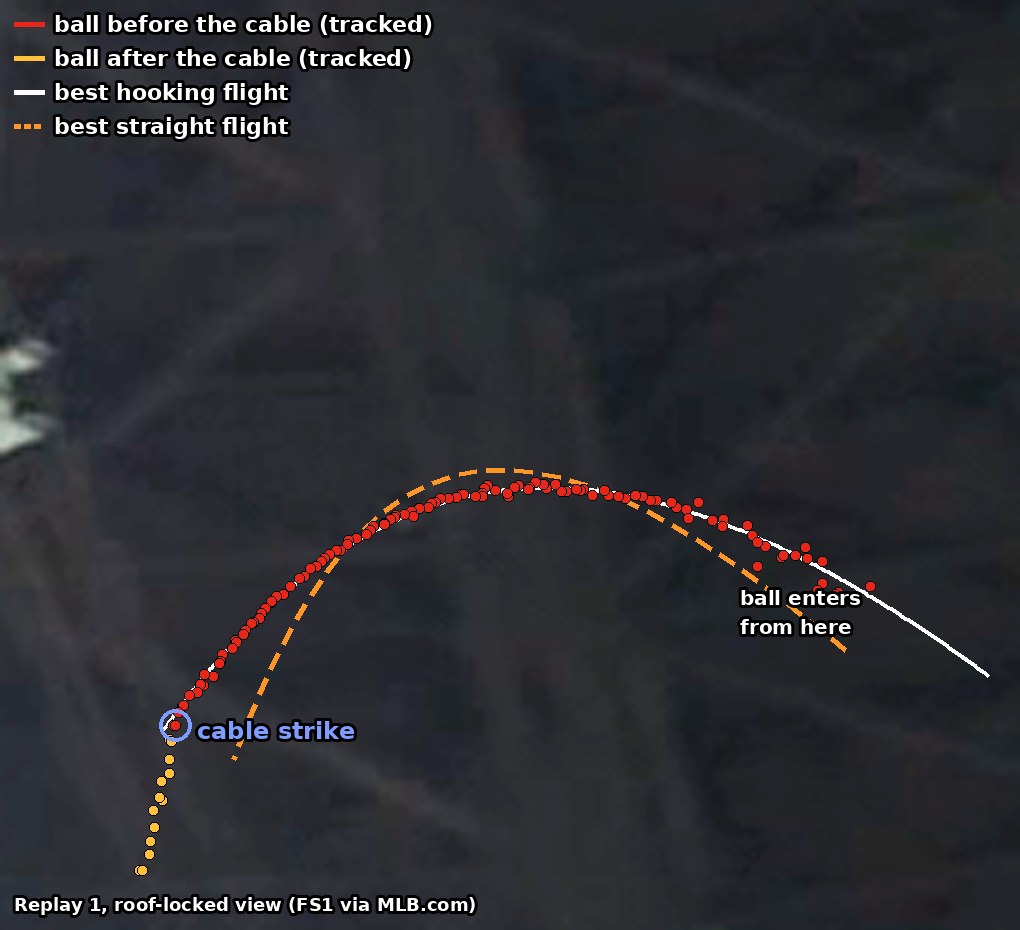
No straight flight can follow that path. Flights that hook toward the line, with roughly 500 to 1,000 rpm of sidespin, follow it almost exactly. Shown only the first part of the path, they also predict the rest.
Fair at the cable, curling toward foul
France’s ball started a few degrees inside the line and hooked back toward it. When it hit the cable it was still fair, by about 1 to 7 feet, so the call stands. But it was heading for the line, and the cable knocked it back toward fair territory. That’s why Chourio caught it comfortably inside the line, and why Statcast’s direction, taken from the catch, made the ball look safely fair.
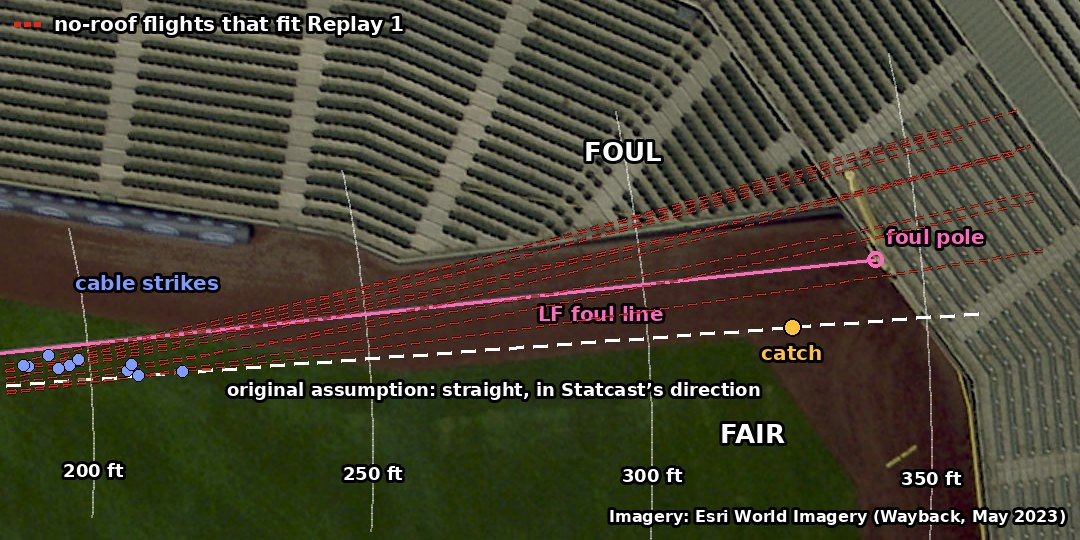
Without the roof, the hook keeps going. Nine of the ten best-matching flights cross the foul line well before the wall and pass the pole 4 to 20 feet foul. The one exception, with the lightest hook, stays about 3 feet fair.
How sure is this?
Fairly. Without sidespin, even the best flight misses the ball’s path by several times our tracking error; with it, flights match to within that error. Fit to the first part of the path, a hooking flight predicts the rest to within 0.03°, while the best straight flight misses by 0.8°. As an independent check, the same camera followed William Contreras’s home run into the right-center seats, and our calibrated camera puts its landing within about a foot of Statcast’s.7
The main caveats: it’s one camera, since every MLB clip of the play reuses the same broadcast shots; our spin model is simple; and at one edge of the camera’s uncertainty, a lighter hook that stays fair fits almost as well. That’s the exception above.
What changed elsewhere in this post
- Problem 2 now places Replay 1’s camera about 56 feet behind home plate and 10 feet up (re-aiming it moved it from about 66 feet), and the 3D views use the new position.
- The objection “Wasn’t it foul?” and “How sure are we, really?” now include the measured direction.
So the roof did three things that night: it stopped the ball, it kept the cold out, and it kept the ball fair. Without it, France’s fly ball probably had the distance. It probably didn’t stay fair.
What a skeptic should ask
A conclusion is only as good as the attacks it survives. Here is every objection we could think of, and what happens to the answer when we change the assumption it targets. Each “what if” below is a complete re-run of the analysis.
“Statcast says it’s a home run in only 1 of 30 parks.”
“Balls hit 105 mph at 49° are almost always outs.”
“What if the cable was lower than 175 feet?”
“Your timing comes from slow motion. The live broadcast says 5.94 s.”
“Everything hinges on the catch spot. How sure are you of it?”
“Maybe the ball was already falling when it hit the cable.”
“What if the cable strike happened earlier or later?”
“The physics model is just a model.”
“From above, the cable strike looks like it was over foul territory. Wasn’t it foul?”
“What about wind?”
| Assumption | P(HR) | Harsh priors | Landing |
|---|---|---|---|
| Baseline (everything as measured) | 68% | 47% | 358 ft |
| No camera-match weighting | 63% | 40% | 357 ft |
| Cable as low as 150 ft | 66% | 45% | 358 ft |
| Cable as low as 160 ft | 66% | 45% | 358 ft |
| No “still rising” requirement | 68% | 47% | 358 ft |
| Live-broadcast timing (5.94 s) | >99% | >99% | 388 ft |
| Longer flight (6.65 s) | 49% | 29% | 354 ft |
| Longer flight (6.80 s) | 43% | 22% | 353 ft |
| Catch at 322 ft | 54% | 32% | 354 ft |
| Catch at 330 ft | 85% | 73% | 363 ft |
| Cable strike window 0.08 s earlier | 66% | 44% | 357 ft |
| Cable strike window 0.08 s later | 68% | 47% | 358 ft |
| Cable doesn’t reduce backspin | 61% | 38% | 355 ft |
| Exit velocity 1 mph lower | 65% | 43% | 357 ft |
| Exit velocity 1 mph higher | 71% | 50% | 358 ft |
| Roof open: outside air (58°F) | 50% | 27% | 353 ft |
How sure are we, really?
Less sure than a single number suggests. Here’s what moves the answer most:
- The catch spot. It’s the input the answer is most sensitive to. Statcast and our camera sightlines agree on about 326 ft, but a few feet matter: at 322 ft the probability is 54%, and at 330 ft it’s 85%.
- The weather. Everything up to the verdict assumes the indoor air the ball actually flew through. In the outside air that night, it’s 50% (see “One last thing”).
- Which side of the pole. The probability is for clearing the wall. Measured from Replay 1, the ball was hooking toward the line, and most flights that fit it pass the pole on the foul side (see “Update: Actually, one more thing”). Only the lightest hook that fits stays fair.
- A longer flight. The timing came from two replay cameras, which agree with each other. Shorter timings only strengthen the case; a longer one would weaken it: at 6.65 s the probability is 49%, and at 6.80 s it’s 43%.
- A cable far lower than 175 ft. That’s the stadium district’s figure for its lowest cable (from 2008). Our stress test drops it to 150 ft with almost no change: the verdict rests on the timing, the catch spot and the camera match, not the cable’s exact height.
- The physics model. We used a standard model of drag and spin lift, with spin and drag left free for the evidence to decide. The model reproduces the camera’s view of the flight to within a few inches, which is reassuring, but it’s still a model.
- Hawk-Eye’s raw data. MLB’s tracking system almost certainly recorded this ball’s path up to the cable. If that’s ever released, it would settle the question better than any of this.
Until then: the ball was hit hard enough, high enough, and was carrying well enough that it was still climbing when it reached the roof, about 180 feet up and more than halfway to the wall. Even after a cable knocked it down, it was caught about 326 feet out, roughly 22 feet short of the wall. Take the roof away and it probably had the distance, about two chances in three, as long as you keep the indoor weather. Take the weather away too, and it’s a coin flip. But it was hooking toward the line, and without the cable to knock it back, it most likely would have passed the pole on the foul side: a long strike, not a home run. With the roof, by the rules everyone agreed to before first pitch, it was an out.
Notes and sources
- From the Brewers’ official ground rules: “Batted ball striking roof, roof truss or roof cable over fair territory: In Play. If caught by fielder, batter is out.” Over foul territory, it’s a dead ball. ↩
- Batted balls at 104.5–106 mph and 48.5–49.5°, 2024–26, as reported by OutKick. ↩
- Aerial imagery: Esri World Imagery Wayback, May 3, 2023 release, about 0.18 ft per pixel. The May 2022 imagery gives the same track width, and the 2025 imagery, with a tarp over the grass, shows the same corner. ↩
- Mike Duckett, then director of the stadium district, in 2008, quoted by the Milwaukee Journal Sentinel: “Our lowest cable is 175 feet above the playing field.” ↩
- Each surviving flight is weighted by how common its backspin is (centered on 3,000 rpm), how common its drag is, and how closely it matches the right-field camera’s view. The camera match allows for tracking noise a little larger than the scatter we actually measured in the tracked ball. With deliberately unfavorable weights (heavy spin, high drag) the probability is 47%; leaving the camera match out entirely gives 63%. ↩
- Hourly weather for Milwaukee at 11 p.m. CDT on October 3, from the Open-Meteo historical weather archive: 57.5°F, 78% humidity, light rain starting, and an 8.6 mph wind from the south, which for a ball hit toward the left-field corner is mostly a crosswind. We re-flew the flights in 58°F air at the same elevation; humidity makes very little difference. ↩
- William Contreras’s seventh-inning home run, from the same Baseball Savant game feed: 103.7 mph at 27°, 406 ft, landing about 407 ft from home plate and 13.6° toward right field. Footage: FS1 broadcast via MLB.com, “William Contreras’ go-ahead solo home run”. ↩
Explore further
- Technical 3D model (orbitable stadium, cameras, calibration overlays; desktop recommended)
Data and footage
- Statcast batted-ball data: Baseball Savant game feed and play page
- All video and still frames: FS1 broadcast via MLB.com, “Ty France flies out after review” (2:28, includes the live call, three replays and the umpire review). Also available in MLB Film Room. Clips are excerpted here for commentary and analysis.
- Ballpark: official ground rules (LF line 342 ft, 8-ft wall, roof-cable rule) and roof facts; Milwaukee Journal Sentinel on the 175-ft lowest cable; Seamheads wall distances; OpenStreetMap stadium outline
- Warning track and wall in the left-field corner: Esri World Imagery Wayback (May 2023); catch reported on the track by NBC San Diego; comparable batted balls: OutKick; weather that night: Open-Meteo
Method in one paragraph
Replay timing from counting distinct source frames (59.94 fps), validated against a second replay of the same footage and against a real-time segment. Camera poses solved by least squares from field features against official dimensions. Ball tracked to sub-pixel precision in roof-registered coordinates. Flights simulated with a drag + Magnus-lift model (indoor air at 600 ft elevation, 69°F), scanning drag coefficient 0.22–0.44, backspin 1,000–4,000 rpm, launch angle 48.5–49.5° and spray 41.5–44.5°. Each was kept only if it reaches the cable height in the measured window while rising, admits a physical post-contact knock reaching the catch point at the measured time, and matches the Replay 2 track. Catch spot (323–330 ft) and the left-field corner wall from aerial imagery and the crossing of the live and Replay 2 sightlines. Probability from weighting survivors by spin (3,000 ± 700 rpm), drag (0.32 ± 0.03) and track fit. The open-roof comparison re-flies the same flights in 58°F air. The fair/foul update tracks the ball in Replay 1, locked to the roof with the camera re-aimed on the left-field foul pole, and fits the path seen from behind home plate with flights that add sidespin (−500 to +1,250 rpm), launch angle 48–50°, drag and backspin free, and the cable strike constrained by Replay 2’s timing and height; it was checked by holding out the later part of the path and against Statcast’s landing spot for William Contreras’s home run, filmed by the same camera.